Stop Guessing Where to Expand: A Data-Driven Approach to Market Selection
Most home services companies invest $500K+ in new locations based on gut feel. I built an interactive tool using Census data and business registrations to identify the best expansion markets in 30 seconds. The difference between right and wrong market? $2-3M in revenue over three years.
You're staring at a map of Ohio. Your business is humming along at $8M per year, and you've maxed out your current territory. Whether you run an HVAC company, plumbing business, roofing contractor, or any other home services operation, it's time to expand. But where?
Franklin County looks promising, but so does everyone else. Stark County has potential. Or does it? Your sales director has strong opinions. Your accountant wants projections. Your gut says one thing, your data says another.
Here's the real problem: You're about to invest $500,000+ in a new location, hire a team, sign a lease, and commit the next 18 months of your life. And you're essentially making that decision based on guesses.
Most home services companies expand this way. They pick markets based on:
- Where their competitor just opened
- Where the owner used to live
- Where they got a lead from a customer
- Wherever "feels right"
The internal frustration: You know there's a better way. You're a data-driven operator, but you don't have the data. And even if you did, you don't have time to analyze Census records, business registrations, and demographic trends.
The philosophical wrong: In 2025, $500K decisions shouldn't be made on gut feel. You deserve better data.
Meet Your Guide
I faced this exact problem while researching Ohio markets for my consulting business. Which counties should I focus on? Which markets have the highest density of my ideal clients?
So I did what any data nerd does when faced with a business problem: I built a tool to answer the question definitively.
The Plan
Here's what I created: An interactive market analysis tool that combines:
- Census Bureau demographic data
- Secretary of State business registration records
- Geographic mapping and density analysis
- Industry-specific filtering (HVAC, plumbing, roofing, etc.)
The result? Instead of spending weeks digging through spreadsheets, you can see in 30 seconds which Ohio counties have:
- The highest density of target businesses
- Population demographics that match your ideal customer
- Geographic coverage gaps (opportunity zones)
- Competitive saturation levels
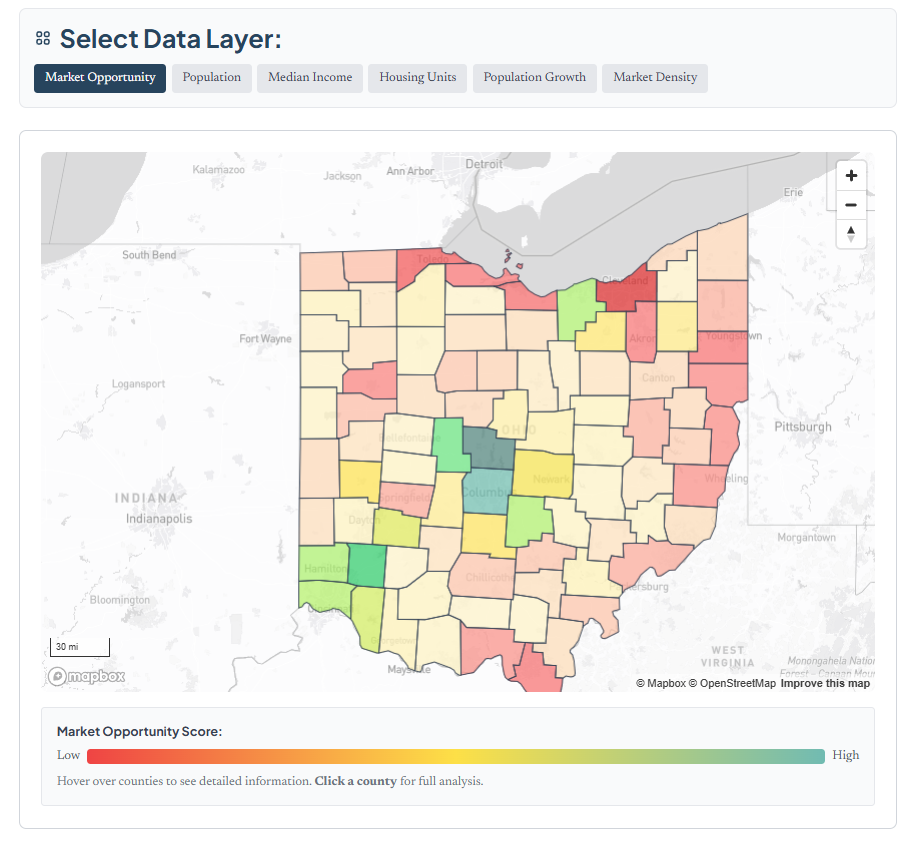
How It Works
- Click on the different data layers to explore demographic dimensions
- Hover over each county to understand their stats
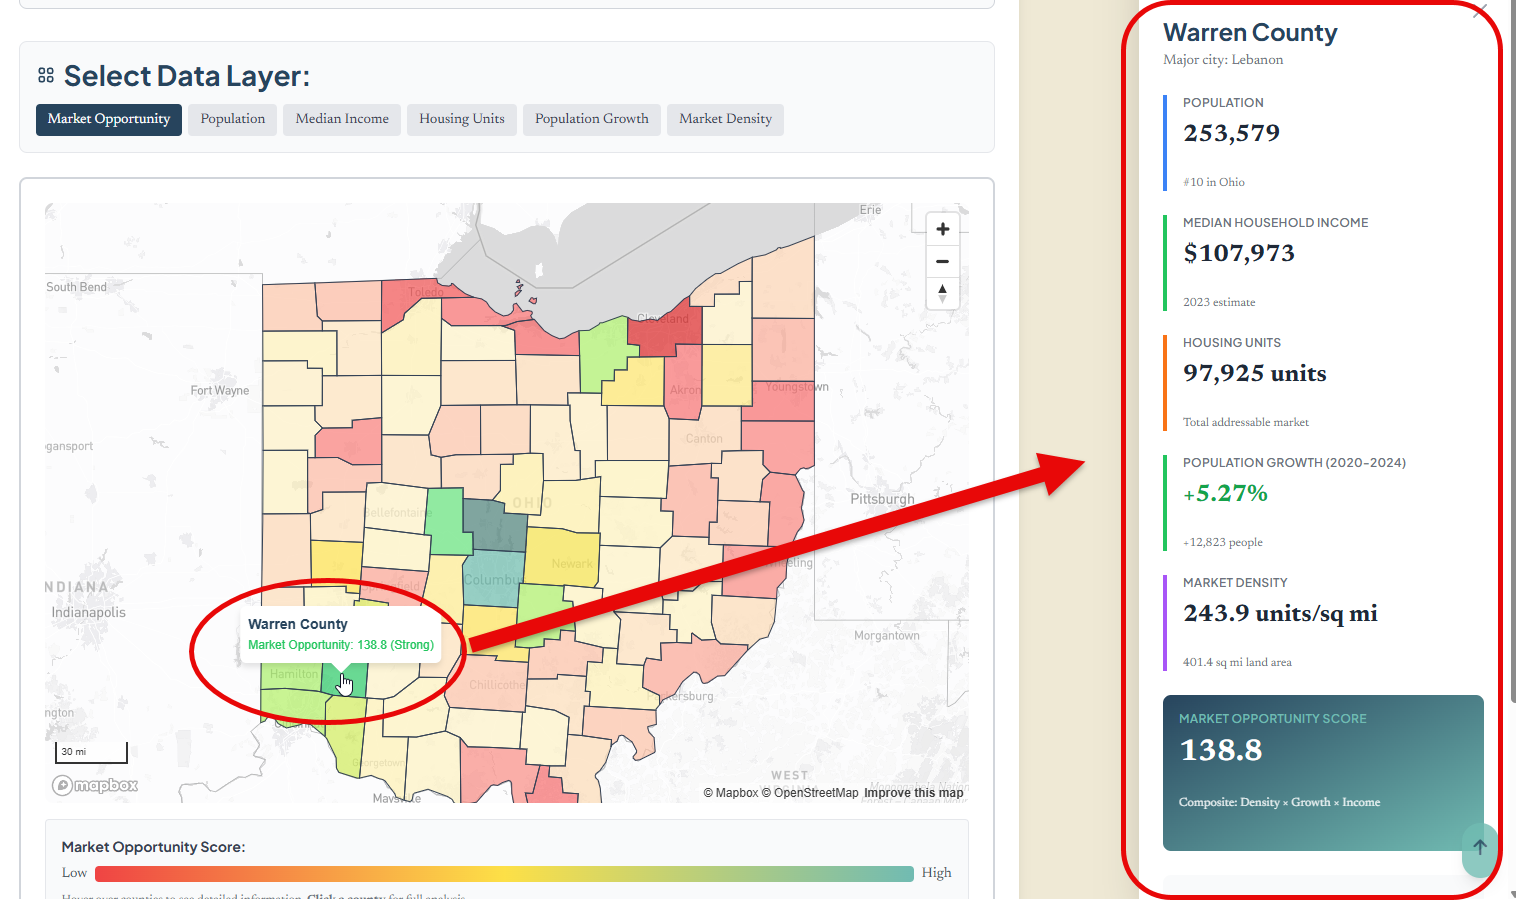
- Click on any county to see all of the detail and their market opportunity score.
Your Next Move
Want to see this analysis for your specific market or industry? Schedule a free discovery call
Or, explore the live tool here and see what you discover. No registration required, completely free.
The Stakes
Here's what's at risk: The difference between picking the right market and the wrong one is about $2-3M in revenue over three years, plus 18 months of your life you won't get back fighting for scraps in an oversaturated market.
I've watched businesses expand into territories that looked good on paper but were already crowded with established competitors. The result? Brutal competition, razor-thin margins, and a slow, expensive exit.
When You Get It Right
But when you pick the RIGHT market (one with strong demographics, reasonable competition, and genuine opportunity) everything changes:
- Your first location hits $2M in year one (not year three)
- You're not fighting for every customer
- Word of mouth spreads faster in an underserved market
- Your team isn't demoralized by constant rejection
The best part? This isn't luck. It's just data-driven decision making.
What I Actually Learned
When I built this tool, I was trying to answer a simple question for my own business: Which Ohio counties should I focus on for client acquisition?
The data told a clear story. Union County, Warren County, Fairfield County, and Lorain County lit up like beacons. High business density, strong demographics, underserved markets. Those four counties became my target list.
But here's what surprised me: The same methodology works for any home services vertical. HVAC companies, plumbing companies, and roofing companies all follow similar density patterns. And it works for any state, not just Ohio. The tool reveals opportunity zones that aren't obvious from surface-level research.
For example:
- Franklin County has 3x the HVAC company density compared to neighboring counties, but only 1.5x the population. Translation: Oversaturated market.
- Lorain County has strong population but lower competition density. Translation: Opportunity.
- Union County is the sleeper. High growth, affluent demographics, fewer established players.
This is the kind of insight that changes your expansion strategy.
Two Ways to Use This
If you're a home services operator considering expansion: The methodology here applies to your business. Whether you're HVAC, plumbing, or roofing, understanding market density and demographic trends helps you avoid expensive mistakes.
Explore the live tool and see what patterns emerge in your industry.
If you're facing a complex business problem that needs a custom solution: This is an example of how I approach problems. Find the right data sources, build the analysis tools, extract actionable insights. The methodology is straightforward, but the results change how you see your market.
The same problem-solving approach works for:
- Customer segmentation and targeting
- Sales territory optimization
- Operational efficiency analysis
- Market opportunity assessment
Your Next Step
For home services companies: Want to see this analysis for your specific market or a different state? Let's talk.
For businesses with complex data problems: Curious how this methodology could apply to your situation? Let's have a conversation.
Or just explore the live tool yourself and see what insights you find.
The Bottom Line
Your expansion decision (or any major business decision) is too important to base on guesswork. Data exists. Tools can be built. Better decisions can be made.
Sometimes you just need someone who knows how to connect the dots.


Comments ()